Bar Chart New
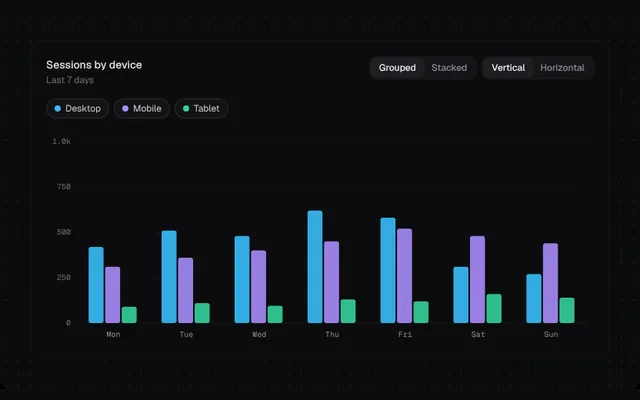
Grouped or stacked bars, vertical or horizontal, with grow-in animation, value labels and a per-category tooltip.
Installation
01
Install with the shadcn CLI. The NiceUI theme comes along the first time.
$ npx shadcn@latest add https://niceui.dev/r/charts-bar-chart.json02
Or copy the source below (2 files). Dependencies: none.
Source
components/niceui/charts/BarChart.tsx
import { useState } from 'react';
import { ChartFrame, Legend, SERIES_COLORS, Segmented, Tooltip, fmt, niceMax, useInView, useToggleSet, useWidth } from './chart-utils';

export type BarSeries = { name: string; color?: string; values: number[] };

export type BarChartProps = {
  labels: string[];
  series: BarSeries[];
  mode?: 'grouped' | 'stacked';
  orientation?: 'vertical' | 'horizontal';
  showValues?: boolean;
  height?: number;
};

export function BarChart({ labels, series, mode = 'grouped', orientation = 'vertical', showValues = true, height = 280 }: BarChartProps) {
  const { ref: wrap, w } = useWidth<HTMLDivElement>();
  const { ref: view, seen } = useInView<HTMLDivElement>();
  const { hidden, toggle } = useToggleSet();
  const [hover, setHover] = useState<number | null>(null);

  const colored = series.map((s, i) => ({ ...s, color: s.color ?? SERIES_COLORS[i % SERIES_COLORS.length] }));
  const visible = colored.filter((s) => !hidden.has(s.name));
  const n = labels.length;
  const horizontal = orientation === 'horizontal';
  const H = horizontal ? Math.max(height, n * 34 + 30) : height;
  const pad = horizontal ? { t: 8, r: 36, b: 20, l: 44 } : { t: 18, r: 8, b: 26, l: 40 };
  const totals = labels.map((_, i) => visible.reduce((a, s) => a + s.values[i], 0));
  const max = niceMax(Math.max(1, ...(mode === 'stacked' ? totals : visible.flatMap((s) => s.values))));
  const innerW = w - pad.l - pad.r;
  const innerH = H - pad.t - pad.b;
  const band = (horizontal ? innerH : innerW) / n;
  const inner = band * 0.68;
  const len = (v: number) => (v / max) * (horizontal ? innerW : innerH);

  type Rect = { x: number; y: number; w: number; h: number; color: string; value: number; si: number };
  const rects: Rect[][] = labels.map((_, i) => {
    let acc = 0;
    return visible.map((s, si) => {
      const v = s.values[i];
      const L = len(v);
      const start = band * i + (band - inner) / 2;
      const thick = mode === 'stacked' ? inner : inner / Math.max(1, visible.length);
      const off = mode === 'stacked' ? 0 : thick * si;
      const from = mode === 'stacked' ? len(acc) : 0;
      acc += v;
      return horizontal
        ? { x: pad.l + from, y: pad.t + start + off, w: L, h: thick - (mode === 'grouped' ? 2 : 0), color: s.color, value: v, si }
        : { x: pad.l + start + off, y: pad.t + innerH - from - L, w: thick - (mode === 'grouped' ? 2 : 0), h: L, color: s.color, value: v, si };
    });
  });

  const ticks = [0, 0.25, 0.5, 0.75, 1];
  const tipAt = hover === null ? null : rects[hover];

  return (
    <div ref={view} className="space-y-3">
      <Legend items={colored} hidden={hidden} onToggle={toggle} />
      <div ref={wrap} className="relative w-full" onPointerLeave={() => setHover(null)}>
        <svg width={w} height={H} className="block" role="img" aria-label={`${mode} ${orientation} bar chart`}>
          {ticks.map((f) =>
            horizontal ? (
              <g key={f}>
                <line x1={pad.l + f * innerW} x2={pad.l + f * innerW} y1={pad.t} y2={H - pad.b} stroke="rgba(255,255,255,0.06)" strokeDasharray={f ? '3 4' : undefined} />
                <text x={pad.l + f * innerW} y={H - 4} textAnchor="middle" className="fill-ink-500 font-mono text-[10px]">
                  {fmt(f * max)}
                </text>
              </g>
            ) : (
              <g key={f}>
                <line x1={pad.l} x2={w - pad.r} y1={pad.t + innerH * (1 - f)} y2={pad.t + innerH * (1 - f)} stroke="rgba(255,255,255,0.06)" strokeDasharray={f ? '3 4' : undefined} />
                <text x={pad.l - 8} y={pad.t + innerH * (1 - f)} dy="0.32em" textAnchor="end" className="fill-ink-500 font-mono text-[10px]">
                  {fmt(f * max)}
                </text>
              </g>
            ),
          )}
          {labels.map((l, i) => (
            <g key={l}>
              <rect
                x={horizontal ? pad.l : pad.l + band * i}
                y={horizontal ? pad.t + band * i : pad.t}
                width={horizontal ? innerW : band}
                height={horizontal ? band : innerH}
                fill={hover === i ? 'rgba(255,255,255,0.04)' : 'transparent'}
                onPointerEnter={() => setHover(i)}
                onFocus={() => setHover(i)}
                onBlur={() => setHover(null)}
                tabIndex={0}
                aria-label={`${l}: ${visible.map((s) => `${s.name} ${s.values[i]}`).join(', ')}`}
                className="outline-none"
              />
              {horizontal ? (
                <text x={pad.l - 8} y={pad.t + band * i + band / 2} dy="0.32em" textAnchor="end" className="pointer-events-none fill-ink-400 text-[11px]">
                  {l}
                </text>
              ) : (
                <text x={pad.l + band * i + band / 2} y={H - 8} textAnchor="middle" className="pointer-events-none fill-ink-400 font-mono text-[10px]">
                  {l}
                </text>
              )}
            </g>
          ))}
          {rects.map((group, i) =>
            group.map((r) => (
              <rect
                key={`${i}-${r.si}-${mode}-${orientation}`}
                x={r.x}
                y={r.y}
                width={Math.max(0, r.w)}
                height={Math.max(0, r.h)}
                rx={mode === 'stacked' ? 2 : 3}
                fill={r.color}
                fillOpacity={hover === null || hover === i ? 0.9 : 0.35}
                className="pointer-events-none transition-[fill-opacity] duration-200"
                style={{
                  transformBox: 'fill-box',
                  transformOrigin: horizontal ? 'left center' : 'center bottom',
                  transform: seen ? 'scale(1)' : horizontal ? 'scaleX(0)' : 'scaleY(0)',
                  transition: `transform 0.9s cubic-bezier(0.16,1,0.3,1) ${i * 45 + r.si * 60}ms, fill-opacity 0.2s`,
                }}
              />
            )),
          )}
          {showValues &&
            labels.map((_, i) => {
              if (mode === 'stacked') {
                const t = totals[i];
                return horizontal ? (
                  <text key={i} x={pad.l + len(t) + 6} y={pad.t + band * i + band / 2} dy="0.32em" className="pointer-events-none fill-ink-300 font-mono text-[10px] transition-opacity duration-500" style={{ opacity: seen ? 1 : 0, transitionDelay: '700ms' }}>
                    {fmt(t)}
                  </text>
                ) : (
                  <text key={i} x={pad.l + band * i + band / 2} y={pad.t + innerH - len(t) - 6} textAnchor="middle" className="pointer-events-none fill-ink-300 font-mono text-[10px] transition-opacity duration-500" style={{ opacity: seen ? 1 : 0, transitionDelay: '700ms' }}>
                    {fmt(t)}
                  </text>
                );
              }
              return null;
            })}
        </svg>
        {tipAt && tipAt.length > 0 && hover !== null && (
          <Tooltip
            x={horizontal ? pad.l + len(mode === 'stacked' ? totals[hover] : Math.max(...tipAt.map((r) => r.value))) : pad.l + band * hover + band / 2}
            y={horizontal ? pad.t + band * hover + 4 : Math.min(...tipAt.map((r) => r.y))}
            w={w}
          >
            <p className="mb-1 font-mono text-[10px] text-ink-400">{labels[hover]}</p>
            {visible.map((s) => (
              <p key={s.name} className="flex items-center gap-2 whitespace-nowrap text-ink-100">
                <span className="h-1.5 w-1.5 rounded-sm" style={{ background: s.color }} />
                <span className="text-ink-400">{s.name}</span>
                <span className="ml-auto pl-3 font-mono tabular-nums">{s.values[hover].toLocaleString('en-US')}</span>
              </p>
            ))}
          </Tooltip>
        )}
      </div>
    </div>
  );
}

const LABELS = ['Mon', 'Tue', 'Wed', 'Thu', 'Fri', 'Sat', 'Sun'];
const SERIES: BarSeries[] = [
  { name: 'Desktop', values: [420, 510, 480, 620, 580, 310, 270] },
  { name: 'Mobile', values: [310, 360, 400, 450, 520, 480, 440] },
  { name: 'Tablet', values: [90, 110, 95, 130, 120, 160, 140] },
];

export function BarChartDemo() {
  const [mode, setMode] = useState<'Grouped' | 'Stacked'>('Grouped');
  const [dir, setDir] = useState<'Vertical' | 'Horizontal'>('Vertical');
  return (
    <ChartFrame
      title="Sessions by device"
      sub="Last 7 days"
      right={
        <div className="flex flex-wrap gap-2">
          <Segmented value={mode} options={['Grouped', 'Stacked']} onChange={setMode} />
          <Segmented value={dir} options={['Vertical', 'Horizontal']} onChange={setDir} />
        </div>
      }
    >
      <BarChart labels={LABELS} series={SERIES} mode={mode === 'Grouped' ? 'grouped' : 'stacked'} orientation={dir === 'Vertical' ? 'vertical' : 'horizontal'} />
    </ChartFrame>
  );
}
components/niceui/charts/chart-utils.tsx
import { useEffect, useRef, useState, type ReactNode } from 'react';
import { cn } from '@/lib/cn';

export const SERIES_COLORS = ['#38bdf8', '#a78bfa', '#34d399', '#fbbf24', '#f472b6'];

export const reducedMotion = () => typeof window !== 'undefined' && window.matchMedia('(prefers-reduced-motion: reduce)').matches;

/** Becomes true once the element scrolls into view (or immediately under reduced motion). */
export function useInView<T extends Element>(threshold = 0.25) {
  const ref = useRef<T>(null);
  const [seen, setSeen] = useState(false);
  useEffect(() => {
    if (reducedMotion()) return setSeen(true);
    const el = ref.current;
    if (!el) return;
    const io = new IntersectionObserver(([e]) => e.isIntersecting && (setSeen(true), io.disconnect()), { threshold });
    io.observe(el);
    return () => io.disconnect();
  }, [threshold]);
  return { ref, seen };
}

/** Tracks the rendered width of an element so SVG charts can draw at true pixel size. */
export function useWidth<T extends Element>(fallback = 600) {
  const ref = useRef<T>(null);
  const [w, setW] = useState(fallback);
  useEffect(() => {
    const el = ref.current;
    if (!el) return;
    const ro = new ResizeObserver(([e]) => setW(Math.max(200, Math.round(e.contentRect.width))));
    ro.observe(el);
    return () => ro.disconnect();
  }, []);
  return { ref, w };
}

export const scale = (d0: number, d1: number, r0: number, r1: number) => (v: number) => r0 + ((v - d0) / (d1 - d0 || 1)) * (r1 - r0);

/** Nice upper bound for an axis. */
export function niceMax(v: number) {
  if (v <= 0) return 1;
  const p = Math.pow(10, Math.floor(Math.log10(v)));
  const n = v / p;
  return (n <= 1 ? 1 : n <= 2 ? 2 : n <= 2.5 ? 2.5 : n <= 5 ? 5 : 10) * p;
}

/** Smooth monotone-ish path through points (Catmull-Rom → Bézier, tension 0.5). */
export function smoothPath(pts: [number, number][]) {
  if (pts.length < 2) return '';
  let d = `M${pts[0][0]},${pts[0][1]}`;
  for (let i = 0; i < pts.length - 1; i++) {
    const p0 = pts[i - 1] ?? pts[i];
    const p1 = pts[i];
    const p2 = pts[i + 1];
    const p3 = pts[i + 2] ?? p2;
    const c1x = p1[0] + (p2[0] - p0[0]) / 6;
    const c1y = p1[1] + (p2[1] - p0[1]) / 6;
    const c2x = p2[0] - (p3[0] - p1[0]) / 6;
    const c2y = p2[1] - (p3[1] - p1[1]) / 6;
    d += ` C${c1x},${c1y} ${c2x},${c2y} ${p2[0]},${p2[1]}`;
  }
  return d;
}

export const fmt = (v: number, prefix = '') => prefix + (Math.abs(v) >= 1000 ? (v / 1000).toFixed(v >= 10000 ? 0 : 1) + 'k' : String(Math.round(v)));

export function Legend({ items, hidden, onToggle }: { items: { name: string; color: string }[]; hidden: Set<string>; onToggle: (name: string) => void }) {
  return (
    <div className="flex flex-wrap gap-1.5">
      {items.map((s) => {
        const off = hidden.has(s.name);
        return (
          <button
            key={s.name}
            onClick={() => onToggle(s.name)}
            aria-pressed={!off}
            className={cn('focus-ring flex items-center gap-1.5 rounded-full border px-2.5 py-1 text-xs transition-all', off ? 'border-white/5 text-ink-500' : 'border-white/10 bg-white/[0.03] text-ink-200 hover:bg-white/[0.06]')}
          >
            <span className="h-2 w-2 rounded-full transition-opacity" style={{ background: s.color, opacity: off ? 0.3 : 1 }} />
            {s.name}
          </button>
        );
      })}
    </div>
  );
}

export function useToggleSet() {
  const [hidden, setHidden] = useState<Set<string>>(new Set());
  const toggle = (k: string) =>
    setHidden((h) => {
      const n = new Set(h);
      if (n.has(k)) n.delete(k);
      else n.add(k);
      return n;
    });
  return { hidden, toggle };
}

export function Tooltip({ x, y, w, children }: { x: number; y: number; w: number; children: ReactNode }) {
  const left = Math.min(Math.max(x, 70), w - 70);
  return (
    <div className="pointer-events-none absolute z-10 -translate-x-1/2 -translate-y-full rounded-xl border border-white/10 bg-ink-850/95 px-3 py-2 text-xs shadow-pop backdrop-blur" style={{ left, top: y - 10 }}>
      {children}
    </div>
  );
}

export function Segmented<T extends string>({ value, options, onChange }: { value: T; options: T[]; onChange: (v: T) => void }) {
  return (
    <div className="flex rounded-lg bg-white/[0.04] p-0.5 ring-1 ring-white/5">
      {options.map((o) => (
        <button key={o} onClick={() => onChange(o)} className={cn('focus-ring rounded-md px-2.5 py-1 text-xs font-medium transition-all', value === o ? 'bg-ink-800 text-ink-50 shadow-hairline' : 'text-ink-400 hover:text-ink-200')}>
          {o}
        </button>
      ))}
    </div>
  );
}

export function ChartFrame({ title, sub, right, children, className }: { title: string; sub?: ReactNode; right?: ReactNode; children: ReactNode; className?: string }) {
  return (
    <div className={cn('w-full rounded-2xl bg-ink-900 p-4 shadow-card sm:p-5', className)}>
      <div className="mb-4 flex flex-wrap items-start justify-between gap-3">
        <div className="min-w-0">
          <p className="text-sm font-medium text-ink-100">{title}</p>
          {sub && <div className="mt-0.5 text-xs text-ink-500">{sub}</div>}
        </div>
        {right}
      </div>
      {children}
    </div>
  );
}