Lead Score New
A lead score gauge with a hot, warm or cold label, the factors behind it, an AI explanation and a 30-day trend.
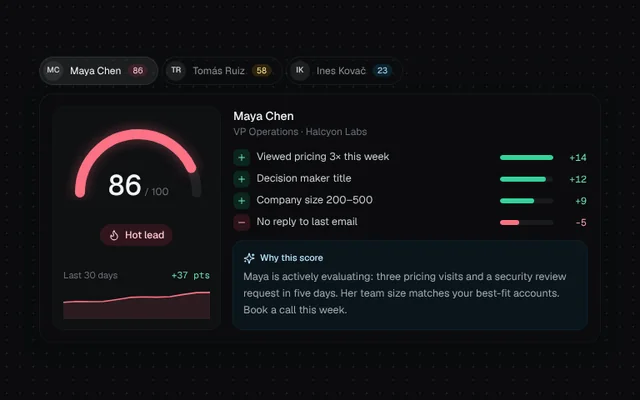
Installation
01
Install with the shadcn CLI. The NiceUI theme comes along the first time.
$ npx shadcn@latest add https://niceui.dev/r/crm-lead-score.json02
Or copy the source below. Dependencies: lucide-react.
Source
components/niceui/crm/LeadScore.tsx
import { useEffect, useState } from 'react';
import { Flame, Minus, Plus, Snowflake, Sparkles, ThermometerSun } from 'lucide-react';
import { cn } from '@/lib/cn';

export type ScoreFactor = { label: string; points: number };
export type Lead = { id: string; name: string; company: string; title: string; score: number; factors: ScoreFactor[]; explanation: string; history: number[] };

const BAND = (s: number) =>
  s >= 70
    ? { label: 'Hot', icon: Flame, chip: 'bg-rose-500/15 text-rose-200', stroke: '#fb7185' }
    : s >= 40
      ? { label: 'Warm', icon: ThermometerSun, chip: 'bg-amber-500/15 text-amber-200', stroke: '#fbbf24' }
      : { label: 'Cold', icon: Snowflake, chip: 'bg-sky-500/15 text-sky-200', stroke: '#38bdf8' };

const reduced = () => typeof window !== 'undefined' && window.matchMedia('(prefers-reduced-motion: reduce)').matches;

function useCount(target: number) {
  const [v, setV] = useState(target);
  useEffect(() => {
    if (reduced()) return setV(target);
    const from = v;
    const t0 = performance.now();
    let raf = 0;
    const tick = (now: number) => {
      const p = Math.min(1, (now - t0) / 900);
      setV(Math.round(from + (target - from) * (1 - Math.pow(1 - p, 3))));
      if (p < 1) raf = requestAnimationFrame(tick);
    };
    raf = requestAnimationFrame(tick);
    return () => cancelAnimationFrame(raf);
    // eslint-disable-next-line react-hooks/exhaustive-deps
  }, [target]);
  return v;
}

function useTyped(text: string) {
  const [n, setN] = useState(text.length);
  useEffect(() => {
    if (reduced()) return setN(text.length);
    setN(0);
    const id = window.setInterval(() => setN((k) => (k >= text.length ? (window.clearInterval(id), k) : k + 2)), 18);
    return () => window.clearInterval(id);
  }, [text]);
  return text.slice(0, n);
}

/** Semicircle gauge from 0–100. */
export function ScoreGauge({ score }: { score: number }) {
  const shown = useCount(score);
  const band = BAND(score);
  const r = 70;
  const len = Math.PI * r;
  return (
    <div className="relative mx-auto w-[180px]">
      <svg viewBox="0 0 180 100" className="w-full" aria-hidden>
        <path d="M20 90 A70 70 0 0 1 160 90" fill="none" stroke="rgba(255,255,255,0.07)" strokeWidth="12" strokeLinecap="round" />
        <path d="M20 90 A70 70 0 0 1 160 90" fill="none" stroke={band.stroke} strokeWidth="12" strokeLinecap="round" strokeDasharray={`${(shown / 100) * len} ${len}`} style={{ filter: `drop-shadow(0 0 8px ${band.stroke}66)` }} />
      </svg>
      <div className="absolute inset-x-0 bottom-0 text-center">
        <span className="font-mono text-[34px] font-medium leading-none tabular-nums text-ink-50">{shown}</span>
        <span className="text-[12px] text-ink-500"> / 100</span>
      </div>
    </div>
  );
}

function History({ data, color }: { data: number[]; color: string }) {
  const pts = data.map((d, i) => `${(i / (data.length - 1)) * 100},${36 - (d / 100) * 32}`).join(' ');
  const change = data[data.length - 1] - data[0];
  return (
    <div>
      <div className="mb-1 flex items-baseline justify-between text-[11px]">
        <span className="text-ink-500">Last 30 days</span>
        <span className={cn('font-mono tabular-nums', change >= 0 ? 'text-emerald-300' : 'text-rose-300')}>
          {change >= 0 ? '+' : ''}
          {change} pts
        </span>
      </div>
      <svg viewBox="0 0 100 40" preserveAspectRatio="none" className="h-10 w-full" aria-hidden>
        <polygon points={`0,40 ${pts} 100,40`} fill={color} opacity="0.12" />
        <polyline points={pts} fill="none" stroke={color} strokeWidth="1.6" vectorEffect="non-scaling-stroke" strokeLinejoin="round" />
      </svg>
    </div>
  );
}

export type LeadScoreProps = { lead: Lead; className?: string };

export function LeadScore({ lead, className }: LeadScoreProps) {
  const band = BAND(lead.score);
  const typed = useTyped(lead.explanation);
  const max = Math.max(...lead.factors.map((f) => Math.abs(f.points)));
  const pos = lead.factors.filter((f) => f.points > 0);
  const neg = lead.factors.filter((f) => f.points < 0);
  return (
    <div className={cn('grid w-full gap-4 rounded-2xl bg-ink-900 p-4 shadow-card sm:grid-cols-[200px_minmax(0,1fr)]', className)}>
      <div className="flex flex-col items-center justify-between gap-3 rounded-xl bg-white/[0.02] p-3 ring-1 ring-white/[0.05]">
        <ScoreGauge score={lead.score} />
        <span key={band.label} className={cn('flex items-center gap-1.5 rounded-full px-2.5 py-1 text-[12px] font-medium animate-scale-in', band.chip)}>
          <band.icon className="h-3.5 w-3.5" /> {band.label} lead
        </span>
        <div className="w-full">
          <History data={lead.history} color={band.stroke} />
        </div>
      </div>
      <div className="min-w-0 space-y-3">
        <div>
          <p className="truncate text-sm font-medium text-ink-50">{lead.name}</p>
          <p className="truncate text-[12px] text-ink-500">
            {lead.title} · {lead.company}
          </p>
        </div>
        <div className="space-y-1.5">
          {[...pos, ...neg].map((f, i) => (
            <div key={f.label} className="flex items-center gap-2 animate-fade-up" style={{ animationDelay: `${i * 50}ms` }}>
              <span className={cn('grid h-5 w-5 shrink-0 place-items-center rounded-md', f.points > 0 ? 'bg-emerald-500/15 text-emerald-300' : 'bg-rose-500/15 text-rose-300')}>
                {f.points > 0 ? <Plus className="h-3 w-3" /> : <Minus className="h-3 w-3" />}
              </span>
              <span className="min-w-0 flex-1 truncate text-[12.5px] text-ink-200">{f.label}</span>
              <span className="hidden h-1.5 w-16 overflow-hidden rounded-full bg-white/[0.06] sm:block">
                <span className={cn('block h-full rounded-full', f.points > 0 ? 'bg-emerald-400' : 'bg-rose-400')} style={{ width: `${(Math.abs(f.points) / max) * 100}%` }} />
              </span>
              <span className={cn('w-8 shrink-0 text-right font-mono text-[11.5px] tabular-nums', f.points > 0 ? 'text-emerald-300' : 'text-rose-300')}>
                {f.points > 0 ? '+' : ''}
                {f.points}
              </span>
            </div>
          ))}
        </div>
        <div className="rounded-xl bg-brand-500/[0.06] p-3 ring-1 ring-brand-500/15">
          <p className="mb-1 flex items-center gap-1.5 text-[11px] font-medium text-brand-200">
            <Sparkles className="h-3.5 w-3.5" /> Why this score
          </p>
          <p className="min-h-[3.4em] text-[12.5px] leading-relaxed text-ink-300">
            {typed}
            {typed.length < lead.explanation.length && <span className="ml-0.5 inline-block h-3 w-[2px] translate-y-0.5 animate-blink bg-brand-300" />}
          </p>
        </div>
      </div>
    </div>
  );
}

/* ——— demo ——— */

const hist = (start: number, end: number, seed: number) => Array.from({ length: 12 }, (_, i) => Math.max(2, Math.min(98, Math.round(start + ((end - start) * i) / 11 + Math.sin(i * 1.3 + seed) * 4))));

const LEADS: Lead[] = [
  {
    id: 'maya',
    name: 'Maya Chen',
    company: 'Halcyon Labs',
    title: 'VP Operations',
    score: 86,
    factors: [
      { label: 'Viewed pricing 3× this week', points: 14 },
      { label: 'Decision maker title', points: 12 },
      { label: 'Company size 200–500', points: 9 },
      { label: 'No reply to last email', points: -5 },
    ],
    explanation: 'Maya is actively evaluating: three pricing visits and a security review request in five days. Her team size matches your best-fit accounts. Book a call this week.',
    history: hist(48, 86, 1),
  },
  {
    id: 'tomas',
    name: 'Tomás Ruiz',
    company: 'Brightfold',
    title: 'Sales Manager',
    score: 58,
    factors: [
      { label: 'Pilot completed', points: 11 },
      { label: 'Opened 4 of 5 emails', points: 6 },
      { label: 'Not the budget owner', points: -7 },
      { label: 'No activity in 9 days', points: -4 },
    ],
    explanation: 'The pilot went well, but Tomás does not control budget. Ask him to introduce the Head of Sales and send the pilot results as a one-page summary.',
    history: hist(62, 58, 3),
  },
  {
    id: 'ines',
    name: 'Ines Kovač',
    company: 'Quarry & Co',
    title: 'Office Manager',
    score: 23,
    factors: [
      { label: 'Downloaded a guide', points: 4 },
      { label: 'Company size under 20', points: -8 },
      { label: 'Free email domain', points: -6 },
      { label: 'Unsubscribed from nurture', points: -9 },
    ],
    explanation: 'Low fit and low intent: a small team, a personal email address and an unsubscribe last week. Keep in the newsletter and revisit next quarter.',
    history: hist(31, 23, 5),
  },
];

export function LeadScoreDemo() {
  const [k, setK] = useState(0);
  return (
    <div className="mx-auto w-full max-w-2xl space-y-3">
      <div className="flex flex-wrap gap-1.5" role="tablist" aria-label="Lead">
        {LEADS.map((l, i) => {
          const b = BAND(l.score);
          return (
            <button key={l.id} role="tab" aria-selected={k === i} onClick={() => setK(i)} className={cn('focus-ring flex items-center gap-2 rounded-full py-1 pl-1 pr-3 text-[12px] ring-1 transition-colors', k === i ? 'bg-white/[0.07] text-ink-50 ring-white/15' : 'text-ink-400 ring-white/[0.06] hover:text-ink-100')}>
              <span className="grid h-6 w-6 place-items-center rounded-full bg-white/[0.08] text-[9.5px] font-semibold text-ink-200">{l.name.split(' ').map((p) => p[0]).join('')}</span>
              {l.name}
              <span className={cn('rounded-full px-1.5 font-mono text-[10px]', b.chip)}>{l.score}</span>
            </button>
          );
        })}
      </div>
      <LeadScore lead={LEADS[k]} />
    </div>
  );
}