Sales Dashboard New
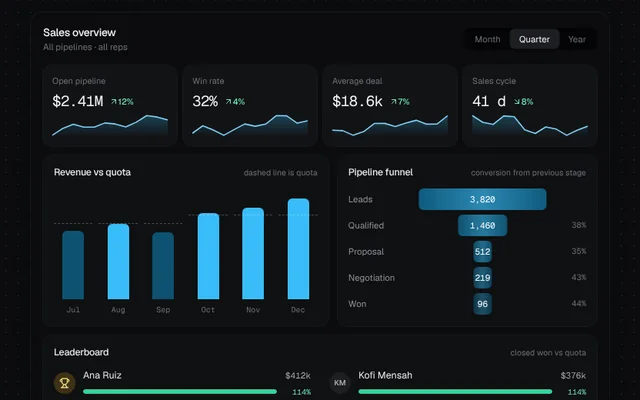
KPI tiles with sparklines, revenue against quota, a pipeline funnel and a rep leaderboard, switchable by period.
Installation
01
Install with the shadcn CLI. The NiceUI theme comes along the first time.
$ npx shadcn@latest add https://niceui.dev/r/crm-sales-dashboard.json02
Or copy the source below. Dependencies: lucide-react.
Source
components/niceui/crm/SalesDashboard.tsx
import { useEffect, useState, type ReactNode } from 'react';
import { ArrowDownRight, ArrowUpRight, Trophy } from 'lucide-react';
import { cn } from '@/lib/cn';

export type Period = 'month' | 'quarter' | 'year';
export type Kpi = { label: string; value: number; format: 'money' | 'percent' | 'days'; delta: number; spark: number[]; goodWhenDown?: boolean };
export type FunnelStage = { label: string; count: number };
export type RevenueBar = { label: string; revenue: number; quota: number };
export type Rep = { name: string; closed: number; quota: number };
export type DashboardData = { kpis: Kpi[]; funnel: FunnelStage[]; revenue: RevenueBar[]; reps: Rep[] };

const money = (n: number) => (n >= 1e6 ? `$${(n / 1e6).toFixed(n >= 1e7 ? 1 : 2)}M` : n >= 1e3 ? `$${(n / 1e3).toFixed(n >= 1e5 ? 0 : 1)}k` : `$${Math.round(n)}`);
const fmt = (k: Kpi, v: number) => (k.format === 'money' ? money(v) : k.format === 'percent' ? `${v.toFixed(0)}%` : `${v.toFixed(0)} d`);

/** Eases a number toward its target whenever the target changes. */
function useTween(target: number, ms = 700) {
  const [v, setV] = useState(target);
  useEffect(() => {
    if (window.matchMedia('(prefers-reduced-motion: reduce)').matches) return setV(target);
    const from = v;
    const t0 = performance.now();
    let raf = 0;
    const tick = (now: number) => {
      const p = Math.min(1, (now - t0) / ms);
      setV(from + (target - from) * (1 - Math.pow(1 - p, 3)));
      if (p < 1) raf = requestAnimationFrame(tick);
    };
    raf = requestAnimationFrame(tick);
    return () => cancelAnimationFrame(raf);
    // eslint-disable-next-line react-hooks/exhaustive-deps
  }, [target, ms]);
  return v;
}

function Spark({ data, up }: { data: number[]; up: boolean }) {
  const max = Math.max(...data);
  const min = Math.min(...data);
  const pts = data.map((d, i) => `${(i / (data.length - 1)) * 100},${28 - ((d - min) / (max - min || 1)) * 24}`);
  const id = up ? 'spk-up' : 'spk-dn';
  return (
    <svg viewBox="0 0 100 30" preserveAspectRatio="none" className="h-8 w-full" aria-hidden>
      <defs>
        <linearGradient id={id} x1="0" x2="0" y1="0" y2="1">
          <stop offset="0" stopColor={up ? '#38bdf8' : '#fb7185'} stopOpacity="0.28" />
          <stop offset="1" stopColor={up ? '#38bdf8' : '#fb7185'} stopOpacity="0" />
        </linearGradient>
      </defs>
      <polygon points={`0,30 ${pts.join(' ')} 100,30`} fill={`url(#${id})`} className="transition-all duration-700" />
      <polyline points={pts.join(' ')} fill="none" stroke={up ? '#7dd3fc' : '#fda4af'} strokeWidth="1.6" vectorEffect="non-scaling-stroke" strokeLinejoin="round" />
    </svg>
  );
}

function KpiTile({ k }: { k: Kpi }) {
  const v = useTween(k.value);
  const good = k.goodWhenDown ? k.delta <= 0 : k.delta >= 0;
  return (
    <div className="min-w-0 rounded-xl bg-white/[0.03] p-3 ring-1 ring-white/[0.05]">
      <p className="truncate text-[11px] text-ink-500">{k.label}</p>
      <div className="mt-1 flex items-baseline gap-2">
        <span className="font-mono text-[19px] tabular-nums tracking-tight text-ink-50">{fmt(k, v)}</span>
        <span className={cn('flex items-center text-[11px] font-medium', good ? 'text-emerald-300' : 'text-rose-300')}>
          {k.delta >= 0 ? <ArrowUpRight className="h-3 w-3" /> : <ArrowDownRight className="h-3 w-3" />}
          {Math.abs(k.delta)}%
        </span>
      </div>
      <Spark data={k.spark} up={good} />
    </div>
  );
}

function Funnel({ stages }: { stages: FunnelStage[] }) {
  const top = stages[0]?.count || 1;
  return (
    <div className="space-y-1.5">
      {stages.map((s, i) => {
        const w = Math.max(14, (s.count / top) * 100);
        const conv = i ? Math.round((s.count / stages[i - 1].count) * 100) : 100;
        return (
          <div key={s.label} className="flex items-center gap-3">
            <span className="w-20 shrink-0 truncate text-[11.5px] text-ink-400">{s.label}</span>
            <div className="relative h-7 min-w-0 flex-1">
              <div className="absolute inset-y-0 left-1/2 -translate-x-1/2 rounded-md bg-gradient-to-r from-brand-500/50 via-brand-400/70 to-brand-500/50 transition-all duration-700 ease-smooth" style={{ width: `${w}%`, opacity: 1 - i * 0.12 }} />
              <span className="absolute inset-0 grid place-items-center font-mono text-[11px] tabular-nums text-white">{s.count.toLocaleString()}</span>
            </div>
            <span className="w-10 shrink-0 text-right font-mono text-[10.5px] tabular-nums text-ink-500">{i ? `${conv}%` : ''}</span>
          </div>
        );
      })}
    </div>
  );
}

function RevenueChart({ bars }: { bars: RevenueBar[] }) {
  const max = Math.max(...bars.map((b) => Math.max(b.revenue, b.quota))) * 1.1;
  return (
    <div>
      <div className="flex h-36 items-end gap-2">
        {bars.map((b) => {
          const hit = b.revenue >= b.quota;
          return (
            <div key={b.label} className="group relative flex h-full min-w-0 flex-1 flex-col justify-end">
              <span className="pointer-events-none absolute -top-1 left-1/2 z-10 -translate-x-1/2 -translate-y-full whitespace-nowrap rounded-md bg-ink-800 px-1.5 py-0.5 font-mono text-[10px] text-ink-100 opacity-0 shadow-pop transition-opacity group-hover:opacity-100">
                {money(b.revenue)} / {money(b.quota)}
              </span>
              <div className="absolute inset-x-0 border-t border-dashed border-white/25 transition-all duration-700 ease-smooth" style={{ bottom: `${(b.quota / max) * 100}%` }} />
              <div className={cn('mx-auto w-full max-w-[28px] rounded-t-md transition-all duration-700 ease-smooth', hit ? 'bg-brand-400' : 'bg-brand-500/45')} style={{ height: `${(b.revenue / max) * 100}%` }} />
            </div>
          );
        })}
      </div>
      <div className="mt-1.5 flex gap-2">
        {bars.map((b) => (
          <span key={b.label} className="min-w-0 flex-1 truncate text-center font-mono text-[10px] text-ink-500">
            {b.label}
          </span>
        ))}
      </div>
    </div>
  );
}

function Leaderboard({ reps }: { reps: Rep[] }) {
  const sorted = [...reps].sort((a, b) => b.closed - a.closed);
  return (
    <ol className="grid grid-cols-[minmax(0,1fr)] gap-x-6 gap-y-2.5 sm:grid-cols-2">
      {sorted.map((r, i) => {
        const att = Math.round((r.closed / r.quota) * 100);
        return (
          <li key={r.name} className="flex items-center gap-2.5">
            <span className={cn('grid h-7 w-7 shrink-0 place-items-center rounded-full text-[10px] font-semibold', i === 0 ? 'bg-amber-400/20 text-amber-200' : 'bg-white/[0.06] text-ink-300')}>
              {i === 0 ? <Trophy className="h-3.5 w-3.5" /> : r.name.split(' ').map((p) => p[0]).join('')}
            </span>
            <div className="min-w-0 flex-1">
              <div className="flex items-baseline justify-between gap-2">
                <span className="truncate text-[12.5px] text-ink-100">{r.name}</span>
                <span className="shrink-0 font-mono text-[11px] tabular-nums text-ink-300">{money(r.closed)}</span>
              </div>
              <div className="mt-1 flex items-center gap-2">
                <div className="h-1.5 min-w-0 flex-1 overflow-hidden rounded-full bg-white/[0.06]">
                  <div className={cn('h-full rounded-full transition-[width] duration-700 ease-smooth', att >= 100 ? 'bg-emerald-400' : 'bg-brand-400')} style={{ width: `${Math.min(100, att)}%` }} />
                </div>
                <span className={cn('w-9 shrink-0 text-right font-mono text-[10px] tabular-nums', att >= 100 ? 'text-emerald-300' : 'text-ink-500')}>{att}%</span>
              </div>
            </div>
          </li>
        );
      })}
    </ol>
  );
}

function Panel({ title, meta, children, className }: { title: string; meta?: string; children: ReactNode; className?: string }) {
  return (
    <section className={cn('min-w-0 rounded-xl bg-white/[0.02] p-3.5 ring-1 ring-white/[0.05]', className)}>
      <div className="mb-3 flex items-baseline justify-between gap-2">
        <h4 className="text-[12.5px] font-medium text-ink-100">{title}</h4>
        {meta && <span className="truncate text-[10.5px] text-ink-500">{meta}</span>}
      </div>
      {children}
    </section>
  );
}

export type SalesDashboardProps = { data: Record<Period, DashboardData>; defaultPeriod?: Period; className?: string };

export function SalesDashboard({ data, defaultPeriod = 'quarter', className }: SalesDashboardProps) {
  const [period, setPeriod] = useState<Period>(defaultPeriod);
  const d = data[period];
  return (
    <div className={cn('w-full rounded-2xl bg-ink-900 p-4 shadow-card', className)}>
      <div className="mb-4 flex flex-wrap items-center justify-between gap-3">
        <div>
          <h3 className="text-sm font-medium text-ink-50">Sales overview</h3>
          <p className="text-[11.5px] text-ink-500">All pipelines · all reps</p>
        </div>
        <div className="relative flex rounded-lg bg-ink-950/60 p-0.5" role="tablist" aria-label="Period">
          {(['month', 'quarter', 'year'] as Period[]).map((p) => (
            <button key={p} role="tab" aria-selected={period === p} onClick={() => setPeriod(p)} className={cn('focus-ring relative rounded-md px-3 py-1 text-[11.5px] capitalize transition-colors', period === p ? 'bg-ink-800 text-ink-50 shadow-hairline' : 'text-ink-500 hover:text-ink-200')}>
              {p}
            </button>
          ))}
        </div>
      </div>
      <div className="grid grid-cols-2 gap-2 lg:grid-cols-4">
        {d.kpis.map((k) => (
          <KpiTile key={k.label} k={k} />
        ))}
      </div>
      <div className="mt-3 grid grid-cols-[minmax(0,1fr)] gap-3 lg:grid-cols-[minmax(0,1.1fr)_minmax(0,1fr)]">
        <Panel title="Revenue vs quota" meta="dashed line is quota">
          <RevenueChart bars={d.revenue} />
        </Panel>
        <Panel title="Pipeline funnel" meta="conversion from previous stage">
          <Funnel stages={d.funnel} />
        </Panel>
      </div>
      <Panel title="Leaderboard" meta="closed won vs quota" className="mt-3">
        <Leaderboard reps={d.reps} />
      </Panel>
    </div>
  );
}

/* ——— demo ——— */

const spark = (seed: number, n = 12, trend = 1) => Array.from({ length: n }, (_, i) => 40 + trend * i * 3 + Math.sin(i * 1.7 + seed) * 8 + Math.cos(i * 0.9 + seed * 2) * 5);

const DEMO: Record<Period, DashboardData> = {
  month: {
    kpis: [
      { label: 'Open pipeline', value: 842000, format: 'money', delta: 6, spark: spark(1) },
      { label: 'Win rate', value: 29, format: 'percent', delta: -3, spark: spark(2, 12, -0.5) },
      { label: 'Average deal', value: 17400, format: 'money', delta: 4, spark: spark(3) },
      { label: 'Sales cycle', value: 38, format: 'days', delta: -5, spark: spark(4, 12, -0.6), goodWhenDown: true },
    ],
    funnel: [
      { label: 'Leads', count: 1240 },
      { label: 'Qualified', count: 486 },
      { label: 'Proposal', count: 171 },
      { label: 'Negotiation', count: 74 },
      { label: 'Won', count: 31 },
    ],
    revenue: ['W1', 'W2', 'W3', 'W4'].map((label, i) => ({ label, revenue: [92000, 128000, 104000, 151000][i], quota: 120000 })),
    reps: [
      { name: 'Ana Ruiz', closed: 138000, quota: 120000 },
      { name: 'Dev Patel', closed: 112000, quota: 120000 },
      { name: 'Sara Lind', closed: 97000, quota: 110000 },
      { name: 'Kofi Mensah', closed: 128000, quota: 110000 },
    ],
  },
  quarter: {
    kpis: [
      { label: 'Open pipeline', value: 2410000, format: 'money', delta: 12, spark: spark(5) },
      { label: 'Win rate', value: 32, format: 'percent', delta: 4, spark: spark(6) },
      { label: 'Average deal', value: 18600, format: 'money', delta: 7, spark: spark(7) },
      { label: 'Sales cycle', value: 41, format: 'days', delta: -8, spark: spark(8, 12, -0.7), goodWhenDown: true },
    ],
    funnel: [
      { label: 'Leads', count: 3820 },
      { label: 'Qualified', count: 1460 },
      { label: 'Proposal', count: 512 },
      { label: 'Negotiation', count: 219 },
      { label: 'Won', count: 96 },
    ],
    revenue: ['Jul', 'Aug', 'Sep', 'Oct', 'Nov', 'Dec'].map((label, i) => ({ label, revenue: [410000, 452000, 398000, 516000, 548000, 602000][i], quota: [450000, 450000, 450000, 500000, 500000, 500000][i] })),
    reps: [
      { name: 'Ana Ruiz', closed: 412000, quota: 360000 },
      { name: 'Dev Patel', closed: 351000, quota: 360000 },
      { name: 'Sara Lind', closed: 289000, quota: 330000 },
      { name: 'Kofi Mensah', closed: 376000, quota: 330000 },
    ],
  },
  year: {
    kpis: [
      { label: 'Open pipeline', value: 9800000, format: 'money', delta: 21, spark: spark(9) },
      { label: 'Win rate', value: 31, format: 'percent', delta: 2, spark: spark(10) },
      { label: 'Average deal', value: 17900, format: 'money', delta: 9, spark: spark(11) },
      { label: 'Sales cycle', value: 44, format: 'days', delta: -3, spark: spark(12, 12, -0.3), goodWhenDown: true },
    ],
    funnel: [
      { label: 'Leads', count: 14600 },
      { label: 'Qualified', count: 5480 },
      { label: 'Proposal', count: 1930 },
      { label: 'Negotiation', count: 820 },
      { label: 'Won', count: 352 },
    ],
    revenue: ['Q1', 'Q2', 'Q3', 'Q4'].map((label, i) => ({ label, revenue: [1180000, 1310000, 1260000, 1666000][i], quota: [1250000, 1300000, 1350000, 1500000][i] })),
    reps: [
      { name: 'Ana Ruiz', closed: 1520000, quota: 1440000 },
      { name: 'Dev Patel', closed: 1310000, quota: 1440000 },
      { name: 'Sara Lind', closed: 1090000, quota: 1320000 },
      { name: 'Kofi Mensah', closed: 1490000, quota: 1320000 },
    ],
  },
};

export function SalesDashboardDemo() {
  return (
    <div className="mx-auto w-full max-w-3xl">
      <SalesDashboard data={DEMO} />
    </div>
  );
}